United States Market Crash Risk: Live Indicators
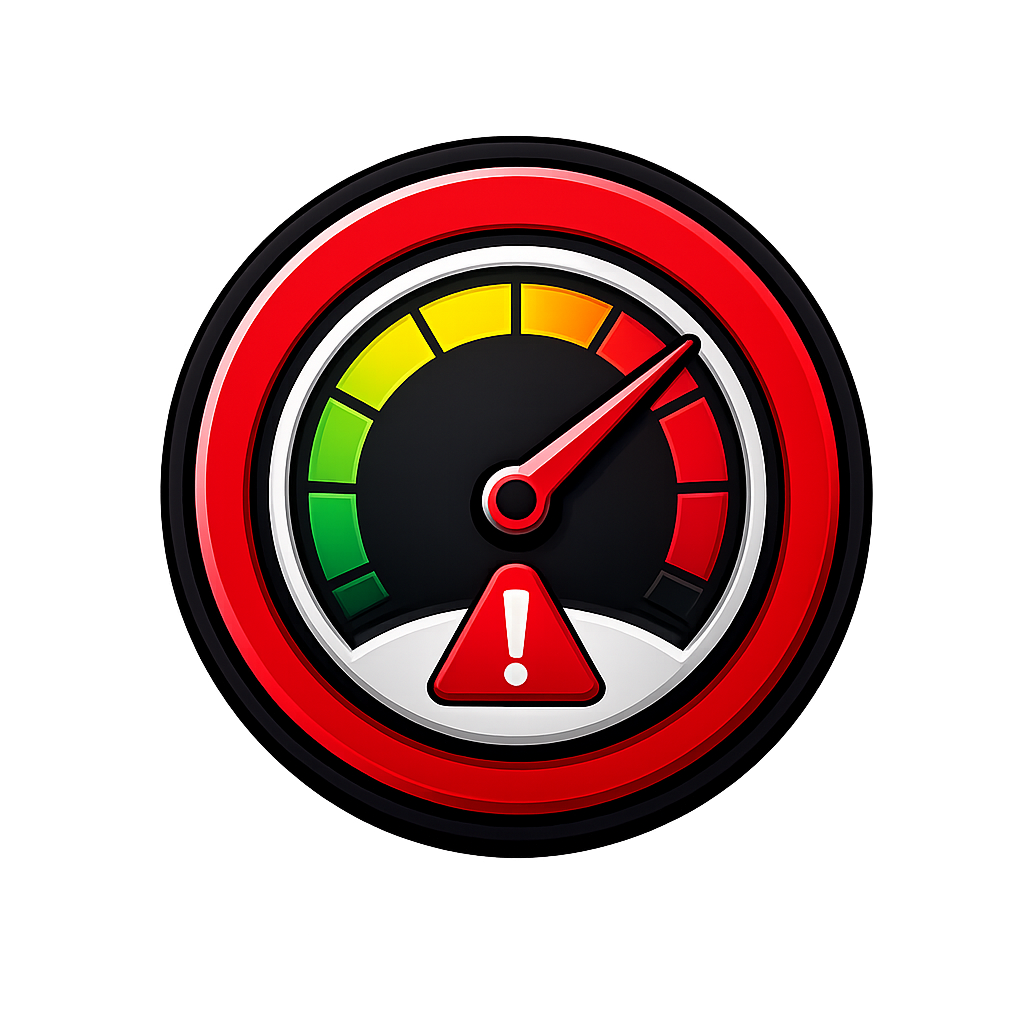
Crash Probability
Indicators
Historical Crash Probability
Grey bands indicate recession periods. Dashed lines mark risk thresholds (30% moderate, 60% elevated, 80% extreme).
Indicator Details
About the United States Crash Risk Dashboard
This dashboard estimates the probability of a significant market downturn in United States by monitoring 14 economic and valuation indicators. Each indicator is ranked against roughly 30 years of monthly data to produce a percentile, then weighted by empirical importance and combined into a single 0–100% crash-probability reading.
Key indicators tracked include the yield-curve spread, credit spreads, unemployment trends, purchasing managers' index (PMI), consumer confidence, and volatility measures. For the United States the model also includes the CAPE price-to-earnings ratio and the Buffett Indicator. A non-linear “extreme-clustering” amplifier raises the composite when multiple indicators simultaneously exceed the 90th percentile, a pattern that has historically preceded major market corrections.
The historical timeline chart shows how the composite crash probability has evolved, with grey bands highlighting official recession periods. Use the range selector to zoom into specific timeframes.
This tool is for informational and educational purposes only and does not constitute financial advice. See our methodology and disclaimer for full details.
Explore Other Markets
More Tools
- Global Economic Risk Map: OECD leading-indicator data for 50+ countries.
- Compare Countries: side-by-side crash probability for up to three markets.
- Pre-Crash Analysis: compare today’s readings to conditions before historical crashes.